EEGrunt update: Analyze heart rate and HRV with Python
A year ago we released EEGrunt and wrote an announcement post here on The Autodidacts, which included a brief overview of what EEGrunt was good for and a quick getting-started tutorial.

EEGrunt is a collection of Python EEG analysis tools, with functions for reading EEG data from CSV files, converting and filtering it in various ways[1], and finally generating pretty and informative visualizations[2].
To celebrate EEGrunt's first birthday, we decided to spruce it up a bit by adding tools for Electrocardiography (recording electrical signals from the heart) and computing interesting things like heart rate variability (HRV).
Analysing Electrocardiography data with EEGrunt
Collect some data
The first thing you need to make rabbit stew is the rabbit, as Bugs Bunny once informed Wile E. Coyote; the first thing you need to analyze ECG data is ECG data.
For this tutorial, we’ll be using ECG data recorded with an OpenBCI board and an electrode on each wrist. There are many tutorials on how to do this, but in our typically unbiased way we’re going to suggest that you follow our wonderful tutorial on using the OpenBCI to record a basic ECG (electrocardiogram).
Once you’ve got your ECG data in hand, download the current EEGrunt code from the repo. If you use git, you can clone it with:
git clone https://github.com/curiositry/EEGrunt.git
If you haven't used EEGrunt before, you might want to follow our original EEGrunt tutorial to get EEGrunt installed and test it with the included sample data. When you have EEGrunt running, you’re ready to get to the heart of the matter!
Git the beat on
First, open the file called analyze_ecg_channel.py from the EEGrunt directory.
Change the filename and path variables to match the location of your recorded ECG data. For example, if your data is in a folder called ecg in the EEGrunt data directory, the line in analyze_ecg_channel.py would look like:
filename = 'your-ecg-data.txt'
Time to do some analysis!
If you’re one of those people who doesn’t dig reading the docs until you’ve already found out why you might need to read the docs, you can go ahead and run
cd /path/to/EEGrunt
python analyze_ecg_channel.py
and see what happens. Otherwise — or once you’ve done that — read on!
Calculating heart rate
The next step is the plot_heart_rate() function[3]. Running this will generate a plot of heart rate in BPM over the session, which should look something like this:
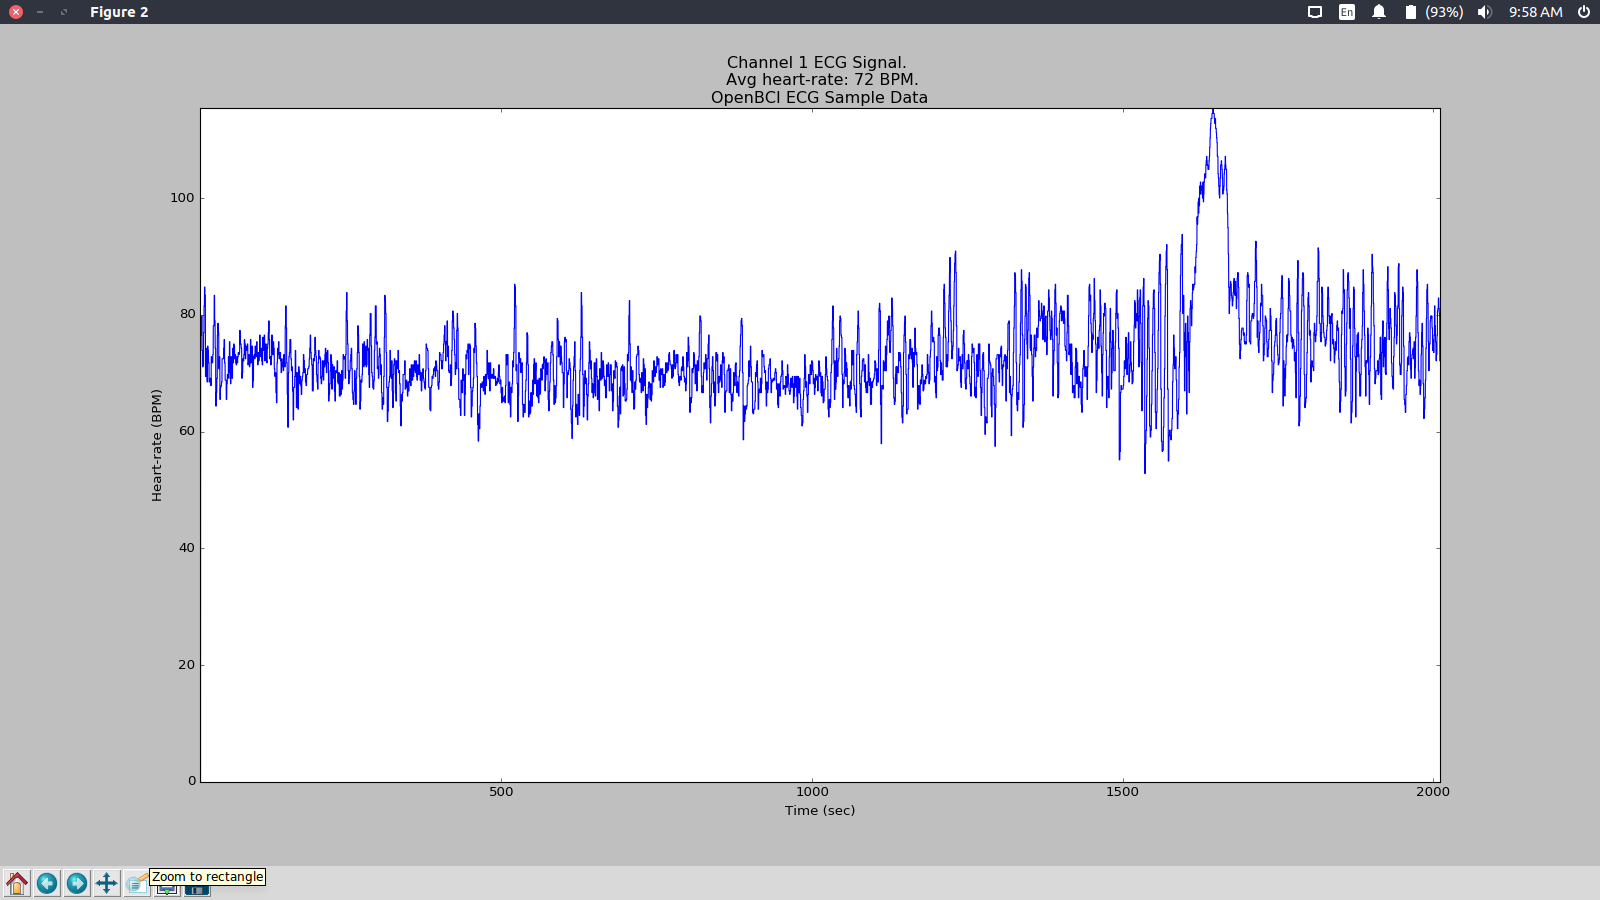
At the top of the plot is the average heart rate for the entire session.
To calculate the data for this plot, plot_heart_rate() calls a lower level function, get_rr_intervals(), which does the fun stuff to extract heart rate from the ECG recording.
It does this using a crude algorithm that Adam cooked up during a protracted head scratching session. (In other words, if it breaks you can talk to him about it, since that’s what I’d do anyway.)
For anyone interested in the technical details, get_rr_intervals() first smooths the signal to remove higher-frequency components, then extracts the differences between consecutive samples using Numpy's diff() function. The differences are a rough measure of the rate of change in the signal, which will (with smoothing) be greatest during the slope leading to the R peak in the heartbeat. To detect these peaks, we then calculate a threshold value from the average of the absolute values of the differences, which is multiplied by a constant factor that can be adjusted if necessary. When the differences exceed the threshold, a heart beat is counted. See below for a plot that shows some of this visually.
Heart rate variability (HRV)
There are many ways to define and measure HRV (as the Wikipedia article on the topic makes clear). We have used the simplest of them: the standard deviation of R-R intervals. This is calculated over the length of the whole recording to give a value for overall variation, as well as over a rolling window to give a profile of changes in HRV over the session.
This line in analyze_ecg_channel.py sets the length of the standard deviation window in seconds:
EEG.hrv_window_length = 10
Once that’s set, EEG.plot_hrv() generates a plot of HRV over the session, which should look something like this:
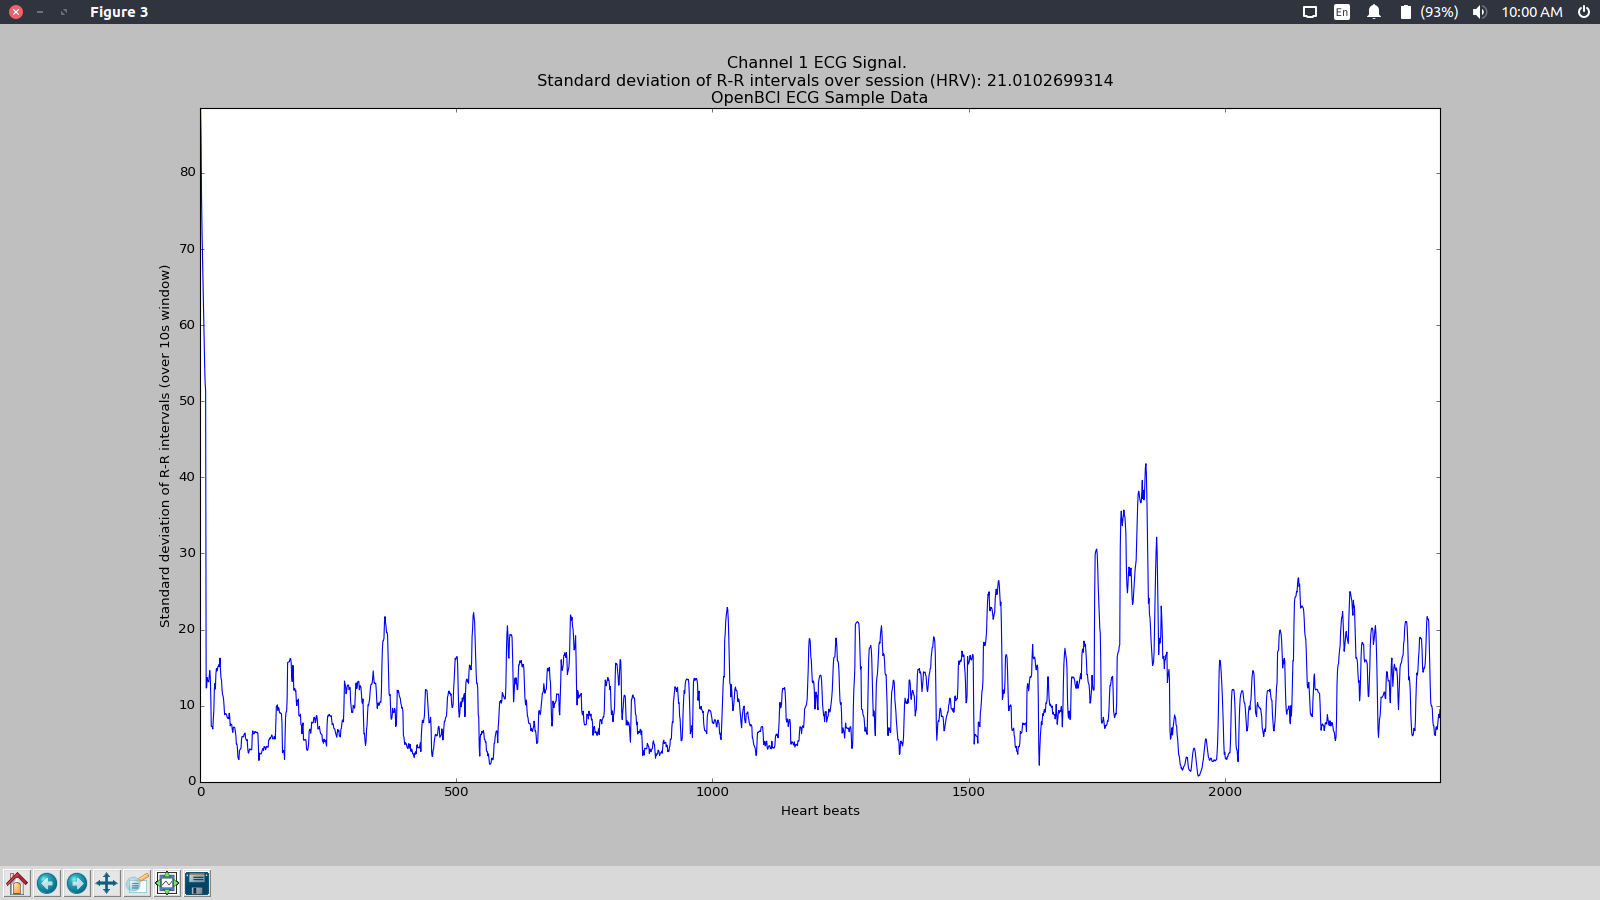
HRV for the session as a whole appears near the top of the plot.
The algorithm introspection plot
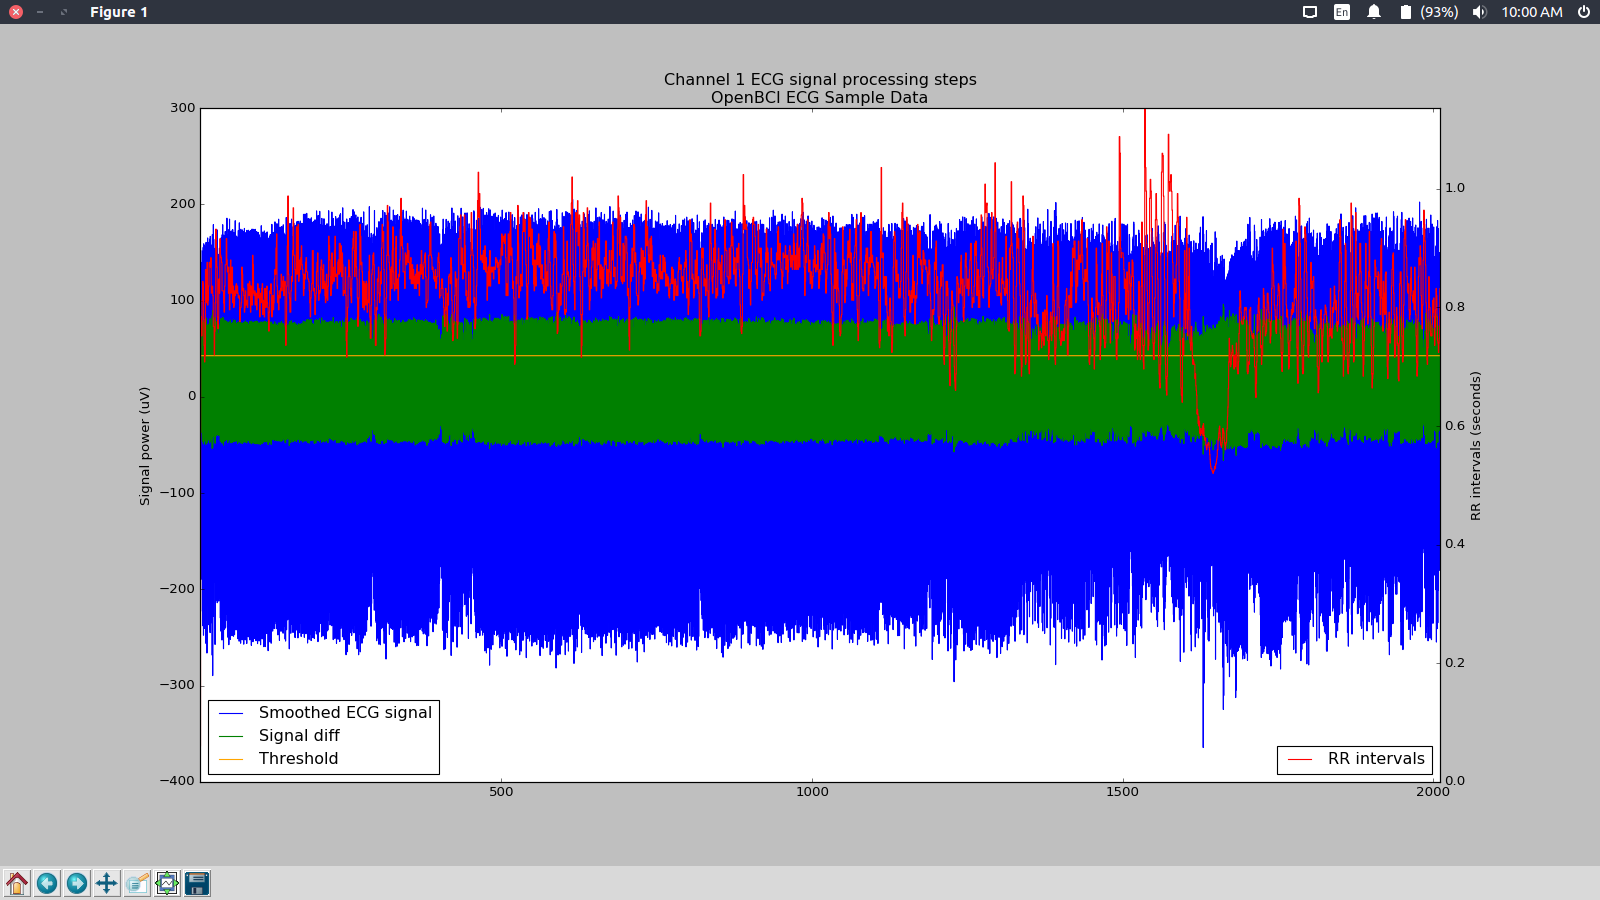
If anything doesn’t look quite right with the heart rate or HRV plots, you can run EEG.plot_rr_intervals() to see visualizations of some of the intermediate steps in the process. This shows a plot of the R-R interval duration for each heartbeat, a plot of the original ECG signal, and a third plot showing the sample-to-sample differences calculated in get_rr_intervals().
If you’re running this on Ubuntu linux, your plots will probably open in PyPlot’s plot viewer. Using the plot viewer’s magnify tool you can zoom in on a particular area of interest and the plot will reshape itself accordingly:
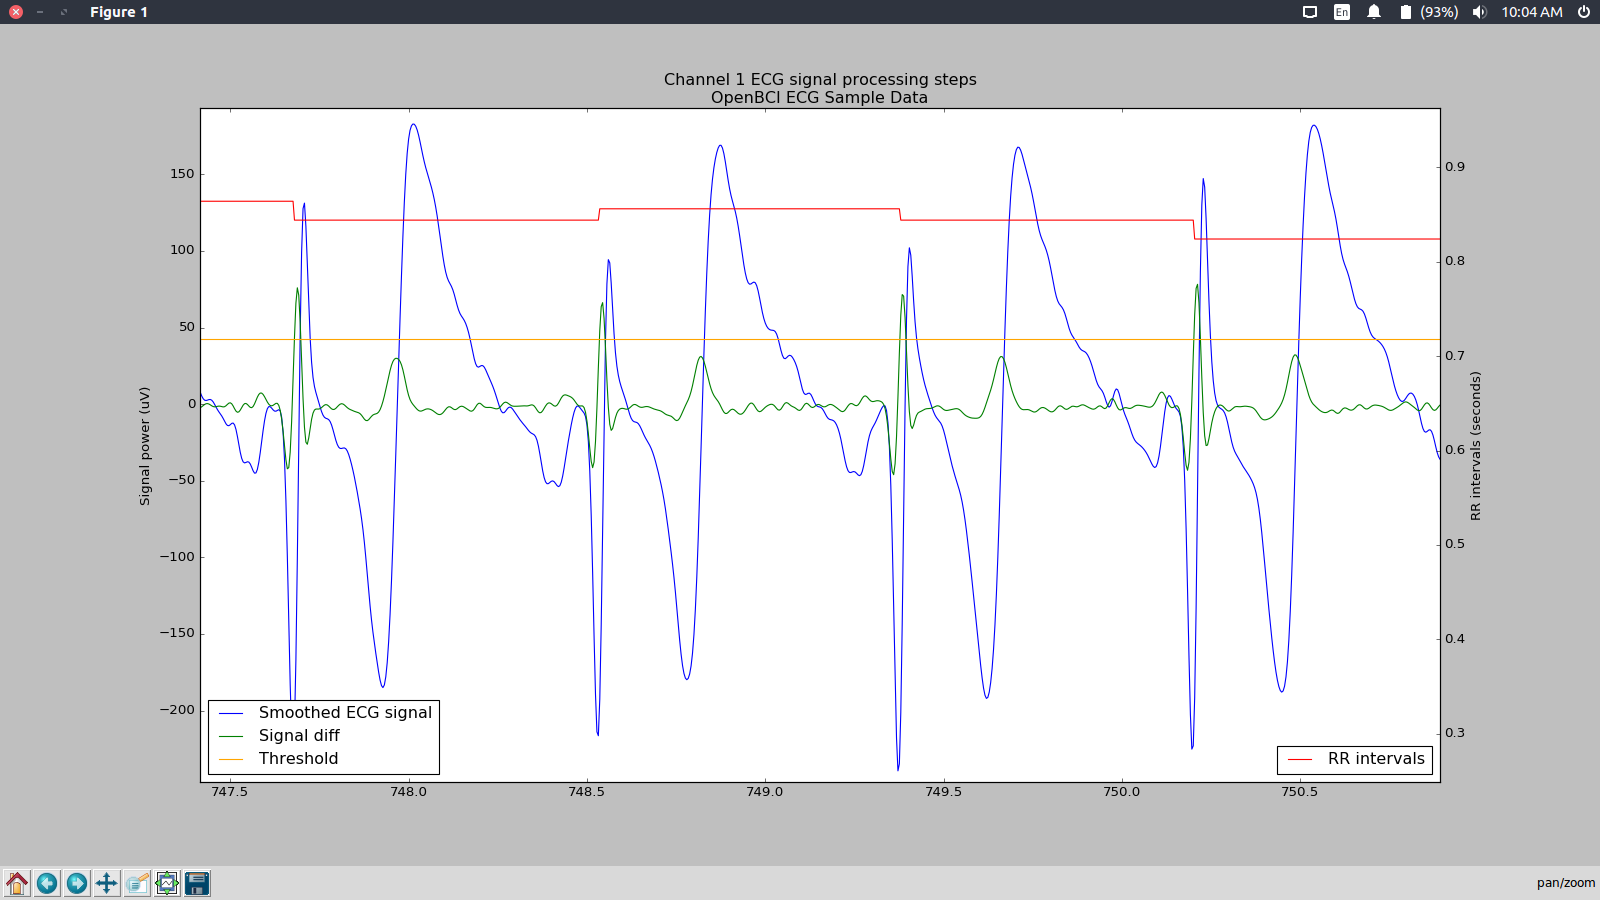
In this example, the blue line is the original ECG signal, after smoothing. The green line is the sample-to-sample differences in the smoothed ECG signal. Note that even though the secondary peaks in this section of recording are higher than the R peaks, because the rate of change leading to the R peaks is greater, the diff plot is highest leading to the R peaks (which is what we want). The orange line is the threshold. As long as this line is clipping the R peak spikes on the diff line and nothing else, heart rate detection is working properly. The red line is the R-R interval. Each time a beat is detected, the time since the last beat is recorded as the R-R interval.
If you see spikes or troughs in R-R intervals plot that aren’t being caused by artefacts in the EEG signal, try adjusting the threshold factor by setting a slightly lower or higher value for EEG.ecg_threshold_factor in analyze_ecg_channel.py (the default for this value is 6, which has worked well on the samples we have tried so far).
Conclusion
We hope this little update to EEGrunt will give you a head-start on DIY ECG analysis. Once you have a hang of the basics, take a look at some of the scientific literature on the topic, or just read the Wikipedia pages on ECG, heart rate, and heart rate variability — it’s a fascinating area of study, and there’s still lots to discover.
If you’re a signal processing wizard and have suggestions for how to tune up EEGrunt to do a better job of ECG analysis, please leave a comment below or send a tweet or email our way. Or, better yet, submit a pull request over on the GitHub repository.
If you have any questions, comments, or corrections, let us know below. Otherwise, go grab the EEGrunt code from GitHub and dive in! Thanks for reading.
EEGrunt has bandpass, notch, and highpass filters for cleaning up powerline interference, OpenBCI’s DC offset, and zeroing in on the frequency band you want to analyze. ↩︎
… including signal plots, amplitude trend graphs, spectrograms, and FFT (fast-fouier transform) graphs, etc. ↩︎
The purpose of this footnote is to demonstrate that we know this is technically a method of the EEGrunt object, not a function. ↩︎